The Volatility Arbitrage Edge: A Quick Look at the Unbeatable Tricks
Volatility arbitrage is a sophisticated financial strategy that deviates from conventional trading by treating volatility itself as a tradable asset. Unlike traditional approaches that speculate on the directional movement of a stock or index, this method seeks to profit from discrepancies between the market’s expected volatility and the volatility that is actually realized. This approach is a form of statistical arbitrage, which means it relies on quantitative analysis and statistical probabilities rather than a risk-free, guaranteed profit opportunity. The distinction is crucial, as the strategy is fundamentally a probabilistic bet that relies on accurate forecasting and meticulous risk management.
The report delves into a set of advanced techniques and core principles that are essential for success in this domain. These are not simple hacks but fundamental tenets that, when mastered, can provide a significant advantage. The following sections explore these key concepts in detail, from the foundational discrepancy at the heart of the strategy to the risks that can undermine even the most sophisticated trading models.
- The Unbeatable Tricks at a Glance:
- Mastering the Volatility Premium (The Core Discrepancy)
- The Art of Dynamic Delta-Neutral Hedging
- Unlocking the Volatility Surface (Beyond Simple IV)
- Trading Volatility as a Pure Asset
- Navigating the Hidden Dangers (Risks and Realities)
Trick #1: Mastering the Volatility Premium – The Core Discrepancy
The foundation of volatility arbitrage is a deep understanding of the relationship between implied volatility (IV) and realized volatility (RV). This is the central tenet that defines every trade.
Implied vs. Realized Volatility Explained
Implied volatility (IV) is a forward-looking measure that represents the market’s forecast of future price swings for an underlying asset. It is not directly observable but is derived from the current market price of an option using a pricing model like Black-Scholes. As such, it acts as a gauge of market sentiment and is often referred to as the “fear gauge,” with a notable example being the Cboe Volatility Index (VIX), which measures the market’s expectation of volatility for the S&P 500 index.
In contrast, realized volatility (RV) is a backward-looking, objective measure of an asset’s actual historical price fluctuations over a specified period. It is calculated from historical price data, for instance, by determining the standard deviation of daily price changes.
|
Characteristic |
Implied Volatility (IV) |
Realized Volatility (RV) |
|---|---|---|
|
Time Perspective |
Forward-looking (expected future) |
Backward-looking (actual past) |
|
Nature |
Subjective, market-driven expectation |
Objective measurement from historical data |
|
Calculation |
Derived from option prices using a pricing model (e.g., Black-Scholes) |
Calculated from historical price changes (e.g., standard deviation) |
|
Primary Use |
Option pricing, assessing future risk, gauging market sentiment |
Evaluating past performance, validating historical models |
|
Key Insights |
Often higher than RV due to a “volatility risk premium” |
What a trader is betting on the future will be |
The entire strategy is built on exploiting the divergence between these two metrics. The opportunities arise when the market’s expectation (IV) is misaligned with a trader’s forecast of the actual future volatility (RV).
A trader will go long volatility by purchasing options when they believe that the implied volatility is significantly lower than what the future realized volatility will be. This is essentially a bet that the market has underpriced the potential for future price swings, and the option’s value will increase as implied volatility rises to meet the actual volatility.
Conversely, a trader will go short volatility by selling options when implied volatility is priced higher than the expected realized volatility. The goal in this scenario is to profit from the premium collected as the market’s overestimated volatility expectation (IV) declines to align with the lower, actual realized volatility.
A key structural element to consider is the volatility risk premium. The market frequently prices options at an implied volatility that is higher than the historical or future realized volatility. This premium exists because option sellers take on an open-ended, potentially unlimited risk, and therefore demand extra compensation from buyers, whose risk is predetermined and limited to the premium they pay. This dynamic explains why a short volatility strategy, which involves collecting this premium, can be a persistent and profitable approach, especially during periods of market calm. In contrast, a long volatility position is often a bet against this structural premium, making it a more challenging, and often event-driven, strategy. Successful volatility arbitrage is not about finding a random mispricing; it is about strategically navigating and profiting from this fundamental, market-wide risk premium.
Trick #2: The Art of Dynamic Delta-Neutral Hedging
Volatility arbitrage is a bet on the magnitude of price movement, not its direction. To isolate this volatility exposure and eliminate directional risk, a trader must maintain a delta-neutral portfolio.
The Delta-Neutral Imperative
Delta is one of the “Greeks” in options trading and measures the sensitivity of an option’s price to a change in the underlying asset’s price. A positive delta means the option’s price will move in the same direction as the underlying asset, while a negative delta means it will move in the opposite direction. By balancing a position in options with an offsetting position in the underlying asset (such as buying options and shorting stock), a trader can construct a portfolio where the total delta is zero, thereby neutralizing the risk from small directional price changes.
Gamma Scalping: The Profit Engine
Maintaining a delta-neutral position is not a one-time action; it is a dynamic, continuous process. As the price of the underlying asset moves, the portfolio’s delta shifts, requiring constant re-hedging. This is where another Greek, Gamma, comes into play. Gamma measures the rate of change of an option’s delta. The positive gamma of a long option position means that as the underlying price moves, the trader’s delta exposure increases, necessitating a rebalance.
This dynamic re-hedging process is known as gamma scalping, and it is the primary mechanism through which volatility arbitrage generates profits. As the underlying price fluctuates, a delta-neutral trader must continuously adjust their position by selling a portion of their hedge as the price rises and buying back as it falls to maintain neutrality. This constant “buy low, sell high” action on the underlying asset allows the trader to extract value from the price swings themselves, independent of the overall price direction.
It is important to understand that this process is not merely a risk management tool; it is the very engine of profit generation. The theoretical profit from a correctly forecasted IV/RV divergence is crystallized through the practical, continuous action of gamma scalping. This direct relationship highlights why factors like transaction costs, bid-ask spreads, and market liquidity are so crucial. High costs or an illiquid market can erode the profits generated by the hedging process, turning a theoretically sound strategy into an unprofitable one.
Trick #3: Unlocking the Volatility Surface – Beyond Simple IV
A common misconception is that all options on the same underlying asset with the same expiration date have the same implied volatility, an assumption central to the Black-Scholes pricing model. However, in real-world markets, this assumption is consistently violated, leading to the existence of the volatility smile and volatility skew.
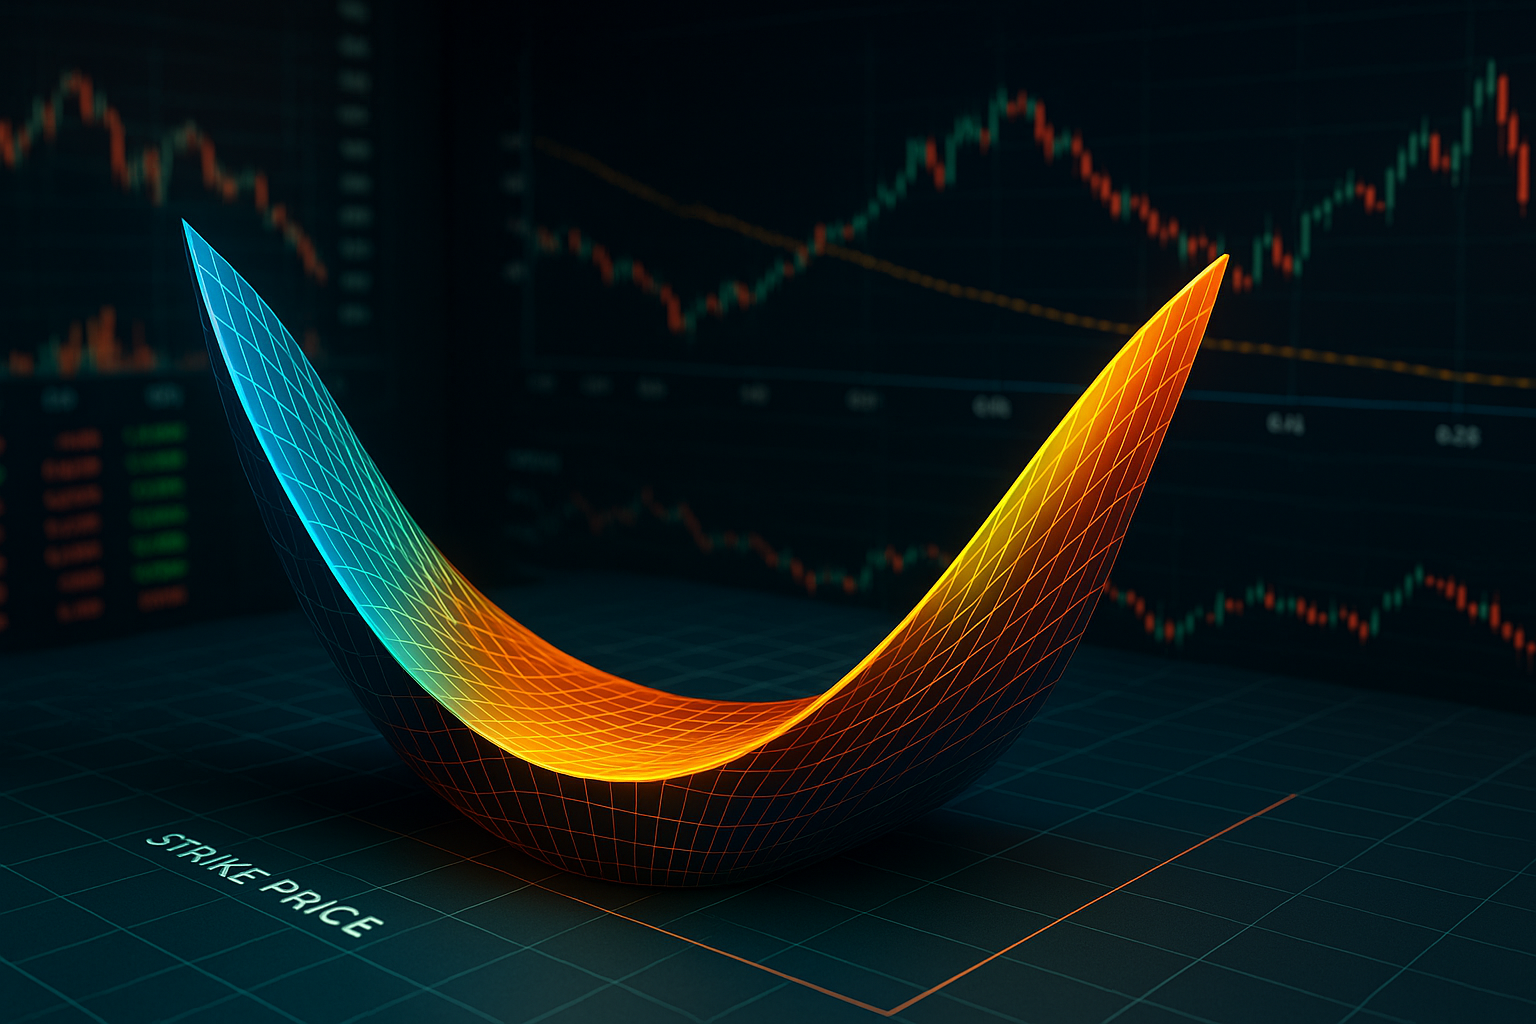
The Volatility Smile & Skew
When the implied volatilities of options with the same expiration are plotted against their strike prices, the result is not a flat line but a curve. A “volatility smile” is a U-shaped curve, where both in-the-money and out-of-the-money options have higher implied volatility than at-the-money options. A “volatility skew” is a downward-sloping curve, more common in equity markets, where the implied volatility of out-of-the-money puts is higher than that of calls. These patterns are not random anomalies; they reflect the market’s collective pricing of risk. For instance, the higher implied volatility for out-of-the-money puts can be attributed to increased demand for “crash insurance” following major market downturns like the 1987 crash.
Trading the Smile
Sophisticated traders do not just use the volatility smile to identify mispricing; they trade the shape of the smile itself.
- Straddle Strategies: A straddle involves buying or selling both a call and a put option with the same strike price and expiration date. A long straddle is a strategy used when a trader expects a significant price move but is uncertain of the direction, such as before a major earnings announcement. The strategy is a direct bet on the high volatility priced into at-the-money options. Conversely, a short straddle is a bet against volatility, designed to profit from time decay if the underlying asset’s price remains stable within a certain range.
- Volatility Spreads: More complex strategies, such as butterfly spreads, exploit specific patterns in the volatility smile by combining long and short options at different strike prices to create a profile that profits from a specific range of price movements while limiting risk.
The volatility smile is a direct, visual representation of the market’s collective, probabilistic assessment of risk, particularly the “fat-tail” risk of extreme, unpredictable events. A trader who bets against the smile is effectively taking the other side of this collective market judgment. This underscores that volatility arbitrage is not about risk-free profit but about using advanced quantitative models and forecasting to identify situations where the market’s probabilistic risk assessment is incorrect.
Trick #4: Trading Volatility as a Pure Asset
The dynamic delta-hedging process, while effective, can be complex and expensive due to continuous transaction costs and market slippage. For large institutions, pure-play volatility instruments offer a more streamlined and elegant solution.
Volatility Swaps and Variance Swaps
Volatility swaps and variance swaps are derivative contracts that provide a direct exposure to future realized volatility. A volatility swap is a forward contract on future realized stock volatility, while a variance swap is a similar contract on variance, which is the square of future volatility. These instruments provide a “pure exposure to volatility alone,” eliminating the need for the complex, dynamic delta-hedging required when using standard options.
The mechanism is straightforward: one party agrees to pay a fixed volatility rate over a set period, while the other agrees to pay the realized volatility. A key advantage is that they allow a trader to place a clean, single bet on the difference between implied and realized volatility without the logistical and financial burdens of continuous rebalancing. The existence and popularity of these instruments among hedge funds and large quantitative firms demonstrate that volatility arbitrage is a scalable, professional strategy that relies on advanced tools and infrastructure. The ability to synthesize a volatility exposure through gamma scalping or to acquire it directly through a swap marks a crucial distinction between retail and institutional trading approaches.
The Hidden Dangers: Risks & Realities
Volatility arbitrage is often perceived as a guaranteed profit strategy, but this is a significant misconception. The ability to successfully navigate the inherent risks is a crucial component of the strategy itself.
1. Model and Forecasting Risk
The entire strategy hinges on a trader’s ability to forecast future realized volatility more accurately than the market. This is far from an exact science. Models used to forecast volatility are often based on historical data and statistical assumptions. However, the dynamic and unpredictable nature of markets means that past trends are not always predictive of future outcomes. An incorrect forecast can lead to substantial losses, and the frequent need for expensive portfolio adjustments to maintain neutrality can quickly erode potential gains.
2. Liquidity and Transaction Cost Risk
Volatility arbitrage requires frequent, high-volume trading to maintain a delta-neutral position. This makes the strategy highly susceptible to liquidity risk and transaction costs. In periods of low liquidity, bid-ask spreads widen and trade execution becomes more difficult and costly. For a large player, the problem is compounded: a massive liquidation order can itself cause a liquidity crisis, pushing prices against the arbitrager and creating a self-reinforcing feedback loop of losses.
3. The Time Decay (Theta) Trap
Options are wasting assets. Their value erodes over time due to theta, one of the options Greeks. A long volatility position (buying options) is constantly working against this time decay. The underlying asset must move enough for the realized volatility to exceed the implied volatility and offset the cost of the premium and the daily theta loss, which can be challenging to achieve within the option’s lifespan.
4. The Black Swan Effect
The most significant risk to volatility arbitrage is the “Black Swan” event, a high-impact, unpredictable event that falls outside the realm of normal expectations. While a delta-neutral portfolio is designed to hedge against small, gradual price movements, it is highly vulnerable to large, sudden market gaps or jumps. The research highlights that in a crisis, the correlations between different assets can converge to one, causing a portfolio’s diversification benefits to vanish and leading to catastrophic, simultaneous losses across multiple positions.
Case Study: The Cautionary Tale of Long-Term Capital Management (LTCM)
The story of Long-Term Capital Management (LTCM) is a canonical example of the risks inherent in statistical arbitrage strategies, including volatility arbitrage. A hedge fund managed by financial luminaries and Nobel laureates, LTCM was initially immensely successful, generating staggering returns in its early years.
The fund’s core strategy was “relative value arbitrage,” which included a “short equity volatility” component. LTCM identified what its models predicted were misaligned asset prices and bet on their convergence, using massive leverage to amplify what were initially small, low-risk returns. The firm was, in essence, selling volatility when its implied value was high, and betting that it would revert to its historical average.
The fund’s downfall in 1998 was not due to a single bad bet but a combination of its extreme leverage and a failure to account for what would later be understood as latent factor risk and endogenous liquidity risk. The Russian financial crisis of that year triggered a global “flight to quality,” which drove up the prices of liquid securities LTCM was short on while simultaneously depressing the prices of the illiquid securities it owned.
This event caused the correlations that LTCM’s models relied on to break down, and the liquidity it was implicitly short on vanished. As the fund began to liquidate its positions to cover its losses, it flooded the market with assets, further depressing their prices and creating a self-perpetuating crisis. This case study demonstrates that a theoretically sound, market-neutral strategy is still vulnerable to catastrophic failure when confronted with unexpected market-wide shocks that break correlations and seize up liquidity.
The Final Verdict: Is Volatility Arbitrage for You?
Volatility arbitrage is a powerful and sophisticated strategy, but it is not a magical trick for effortless profit. The research consistently emphasizes that this is a technique for “veteran traders” and large-scale, quantitatively focused institutions with access to substantial capital and technological resources. It is not suitable for a casual retail investor.
The required toolkit for successful implementation is extensive. A trader must possess a deep theoretical understanding of options pricing models, the options “Greeks” (Delta, Gamma, Vega, Theta), and the nuanced relationship between implied and realized volatility. The strategy demands robust quantitative models, real-time market data, and low-latency trading infrastructure to execute dynamic re-hedging with precision. Moreover, disciplined risk management is paramount, as the strategy is still vulnerable to significant, and sometimes hidden, risks.
Ultimately, the true “unbeatable trick” of volatility arbitrage lies not in a secret formula but in the disciplined, meticulous application of quantitative skill, technological resources, and a thorough understanding of the significant risks involved. When executed with precision, it can generate consistent returns and offer diversification benefits, but it is in no way a risk-free endeavor.
Frequently Asked Questions (FAQ)
- What is the core principle of volatility arbitrage? The core principle is to profit from the difference between an option’s implied volatility (the market’s forecast of future volatility) and the actual, realized volatility of the underlying asset.
- Is volatility arbitrage a risk-free strategy? No. Volatility arbitrage is a form of statistical arbitrage, not a risk-free one. It relies on forecasting and is susceptible to significant risks, including model risk, time decay, and catastrophic “Black Swan” events.
- How does a delta-neutral portfolio work? A delta-neutral portfolio is constructed by balancing a position in options with an offsetting position in the underlying asset to ensure that the total portfolio’s delta is zero. This neutralizes directional price risk, allowing the trader to isolate volatility as the primary source of profit or loss.
- What are the main risks involved? Key risks include inaccurate forecasting of realized volatility, high transaction costs from frequent re-hedging, time decay (theta) that erodes profits, and the potential for a “Black Swan” event to break correlations and trigger massive losses.
- What is the difference between a volatility smile and a volatility skew? A “volatility smile” is a U-shaped curve that shows implied volatility as higher for both in-the-money and out-of-the-money options than for at-the-money options. A “volatility skew,” more common in equity markets, is a downward-sloping curve where the implied volatility of puts is higher than that of calls. Both patterns deviate from the flat curve assumed by the Black-Scholes model.
- Can retail investors use this strategy? The strategy is generally considered too complex and resource-intensive for the average retail investor. It is predominantly used by professional, quantitatively focused hedge funds and trading firms.
- How does Long-Term Capital Management’s failure relate to volatility arbitrage? LTCM’s failure was a cautionary tale in the risks of statistical arbitrage. While its strategy was not pure volatility arbitrage, it had a significant short volatility component. The fund’s downfall demonstrated how massive leverage, combined with the breakdown of asset correlations and a sudden seizing up of market liquidity during a crisis, can lead to a catastrophic failure, even for a fund with a seemingly robust, market-neutral approach.